Measuring Income Elasticity using arc method
Learning
Contents:
· Calculating Income elasticity using Arc elasticity method( Practical Questions)
Income
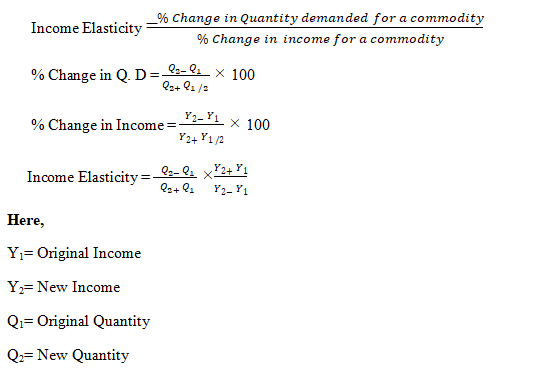
Elasticity of Demand (Arc Elasticity or Midpoint method)
Generally, the arc represents a
portion or segment of some curve shape. When income
elasticity is to be measured over a certain range or between two points on the income
demand curve, we use arc- income elasticity method. It is also known as midpoint method. Unlike the proportionate
method that uses the initial income and initial quantity in denominator (or
base); this method uses the average of both income and quantity in denominator
(or base) for finding the elasticity. Therefore, when using arc elasticity, we
need not to be worried about which point is the starting point and which point
is the ending point since it gives same results whether income rises or falls.
The formula used to calculate the income elasticity of demand using arc method
is,
Calculating
Income elasticity using Arc elasticity method (Practical Questions)
Part-1 Normal Goods (Positive Income Elasticity)
1.
If the income of a consumer increases from ₹15,000 to ₹20,000, leading to an
increase in quantity demanded from 1000 to 2000 units. What will be the income
elasticity of demand?
Also determine whether the product is inferior or normal good? (Use Arc Elasticity method)
Solution:
The following information is given
Y1= ₹15,000 Q1= 1000
Y2= ₹20,000 Q2= 2000
The figure-1 is drawn using the above information.

Plugging these numbers into the formula,

Interpretation
The calculated value of
income elasticity of demand is 2.33 >1 indicating an income-elastic demand
and it is a normal luxury good having positive income elasticity.
2.
Consider that a consumer’s income has increased this year from ₹50,000 to ₹60,000.
A consumer initially bought 3 pairs of designer jeans and then decides to
purchase 5 pairs this year. Determine income elasticity of demand and also tell
whether the designer jeans is a normal good or inferior good?
Solution:
The following
information is given
Y1= ₹50,000 Q1= 3
Y2= ₹60,000 Q2= 5
The figure-2 is drawn using the above information.

Plugging these numbers into the formula,

Interpretation
The calculated value of
income elasticity of demand is 0.36 < 1 indicating an income-inelastic
demand and it is a normal necessity good having positive income elasticity.
3.
Suppose that the demand for tulip flowers increases from 500 to 600 stems when
income rises from ₹10,000 to ₹20,000. The income elasticity of tulip flowers
is:
Solution:
The following
information is given
Y1= ₹10,000 Q1= 500
Y2= ₹20,000 Q2= 600
The figure-3 is drawn using the above information.

Plugging these numbers
into the formula,

Interpretation
The calculated value of
income elasticity of demand is 0.27 < 1 indicating an income-inelastic
demand and it is a normal necessity good having positive income elasticity.
4.
Neha only eats out at Mc-Donald’s and eats out 3 times per month. She receives
an income raise from ₹20,000 to ₹60,000 and decides to eat out 5 times per
month. Use the midpoint method to calculate the monthly income elasticity of
demand for eating out.
Solution:
The following
information is given
Y1= ₹20,000 Q1= 3
Y2= ₹60,000 Q2= 5
The figure-4 is drawn using the above information.

Plugging these numbers
into the formula,

Interpretation
The calculated value of
income elasticity of demand is 0.5 < 1 indicating an income-inelastic demand
and it is a normal necessity good having positive income elasticity.
5.
Megha's salary decreases from
₹40,000 to ₹20,000. She decides to reduce the number of
outfits she purchases each year from 20 to 15. Use the midpoint method to
calculate the income elasticity of demand for new outfits.
Solution:
The following
information is given
Y1= ₹ 40,000 Q1= 20
Y2= ₹ 20,000 Q2= 15
The figure-5 is drawn using the above information.

Plugging these numbers into the formula,

Interpretation
The calculated value of
income elasticity of demand is 0.42<1 indicating an income-inelastic demand
and it is a normal necessity good having positive income elasticity.
6.
Suppose, when income of a consumer is ₹ 700, he demands 45 cups of ice-creams
at a price of ₹ 25 per cup. When his income
increases to ₹ 900, he demands 55 cups of ice-creams at a price of ₹ 21
per cup. Calculate the income elasticity of demand.
Solution:
The following
information is given
Y1= ₹ 700 Q1=
45 P1= 25
Y2= ₹ 900 Q2= 55 P2= 21
The figure-6 is drawn using the above information.

Plugging these numbers
into the formula,

Interpretation
The calculated value of
income elasticity of demand is 0.8< 1 indicating an income-inelastic demand and
it is a normal necessity good having positive income elasticity.
7.
Kabir’s income increases from ₹ 25,000 to ₹ 30,000 per year
and his demand for burger increases from 12 to 14 per year. Determine his
income elasticity.
Solution:
The following
information is given
Y1= ₹ 25,000 Q1= 12
Y2= ₹ 30,000 Q2= 14
The figure-7 is drawn using the above information.

Plugging these numbers
into the formula,

Interpretation
The calculated value of
income elasticity of demand is 0.84< 1 indicating an income-inelastic demand
and it is a normal necessity good having positive income elasticity.
8.
For the following demand schedule calculate income elasticity when income rises
from ₹ 500 to ₹ 600. (Use Arc Elasticity Method)
|
Income (₹) |
400 |
500 |
600 |
700 |
800 |
|
Demand (Kg.) |
10 |
25 |
45 |
55 |
60 |
Solution:
The following
information is given
Y1= ₹ 500 Q1= 25
Y2= ₹ 600 Q2= 45
The figure-8 is drawn using the above information.

Plugging these numbers
into the formula,

Interpretation
The calculated value of
income elasticity of demand is 3.14 > 1 indicating an income-elastic demand
and it is a normal luxury good having positive income elasticity.
Part-2 (Inferior Goods- Negative Income Elasticity)
9.
Bharti consumes 40 boxes of wheat cookies a year when her yearly income is ₹30,000.
After her income rises to ₹40,000 a year, her consumption falls to 10 boxes of wheat
cookies a year. Calculate her income elasticity of demand for wheat cookies. (Use
the midpoint method).
Solution:
The following
information is given
Y1= ₹ 40,000 Q1= 10
Y2= ₹ 30,000 Q2= 40
The figure-9 is drawn using the above information

Plugging these numbers
into the formula,

Interpretation
The calculated value of
income elasticity of demand is -4.2 < 0 indicating an income-inelastic
demand and it is an inferior good having negative income elasticity.
10.
The average annual income rises from ₹25,000 to ₹38,000, and the quantity of
millet consumed in a year by the average person falls from 3 tons to 2.2 tons. What
is the income elasticity of millet consumption? Is millet a normal or an
inferior good?
Solution:
The following
information is given
Y1= ₹ 25,000 Q1= 3
Y2= ₹ 38,000 Q2= 2.2
The figure-10 is drawn using the above information.

Plugging these numbers
into the formula,

Interpretation
Since, the income
elasticity of demand for millet is -0.74 < 0 indicating an income-inelastic
demand and it is an inferior good having negative income elasticity.
11.
Konica’s income increases from ₹20,000 to ₹30,000 and her consumption of pasta changes
from 10 pounds per month to 2 pounds per month. Calculate her income elasticity
of demand.
Solution:
The following
information is given
Y1= ₹ 20,000 Q1= 10
Y2= ₹ 30,000 Q2= 2
The figure-11 is drawn using the above information

Plugging these numbers into the formula,

Interpretation
The calculated value of income elasticity of demand for pasta is -3.33 < 0 indicating an income-inelastic demand and it is an inferior good having negative income elasticity.
Thanks & please share with your friends
Pls. let us know if you have any questions.
Keep Learning....


Comments
Post a Comment