INDIFFERENCE CURVE OF PERFECT COMPLEMENTS
Learning
Contents:
·
Basic
Introduction to Complementary goods,
Indifference curve and MRS
·
Understanding
Perfect complements through schedule & Indifference curve
Introduction
It is very important to
revise the concepts of complementary goods, Indifference curve, and Marginal
Rate of Substitution (MRS) to have a clear understanding of the Indifference curve
of perfect complements.
Complementary
goods
As discussed earlier,
complementary goods are goods that are used together, like fuel/car, pencil/
notebook, or shoe/insole, etc. A consumer cannot make consumption of these goods
separately. Individual consumption of these goods will not create demand. As
far as demand is concerned, an increase in demand of one generates the demand for
the other.
Indifference
curve
An indifference curve
refers to all those combinations of two goods that give the consumer an equal
level of satisfaction or utility. Since
all the combinations offer the same amount of satisfaction, the consumer
prefers them equally. Hence it is named as indifference curve. All the combinations lying on the indifference curve gives
a consumer an equal level of satisfaction.
Marginal
Rate of substitution
Marginal rate of
substitution i.e. MRS or slope of IC that
indicates how much quantity of a good (Say-Y) a consumer is actually willing to
sacrifice in order to gain one more unit of
another good (Say-X) so that the same level of satisfaction could be maintained
was earlier.
UNDERSTANDING
PERFECT COMPLEMENTS SCHEDULE & ITS INDIFFERENCE CURVE
The important thing
about perfect complements is that the consumer prefers to consume both goods in
fixed proportions. In simple words, When two goods are perfect complements of
each other, that means they are supposed to be consumed jointly in fixed proportion
(e.g. one-to-one) instead of separately. In this case, MRS would be equal to zero
because there is no possibility of substitution. Hence, the slope of the perfect
complements indifference curve is not defined and becomes L-shaped.
Learning
through examples of Perfect Complements - Why Indifference curve is L-shaped?
Example
1. A
pair of the left shoe and right shoe: A
consumer does an equal consumption of Left shoe and Right shoe every time that means
any consumption of either more of a commodity or less of a commodity would have
no use or worthless. Looking
at the example of left shoes compared to right shoes: a consumer will have no utility
(or zero marginal utility) either consuming more of left shoes without the right
shoe or less of left shoes with more of right shoes. Simply, if I have 10 right
shoes and 1 left shoe, I am no better off than having 1 right shoe and 1 left
shoe. So, many but equal bundles of right and left shoe - are preferred by the
consumer.
Scenario
1:
Combinations offering the same utility
|
Combinations |
Left
shoe |
Right
shoe |
|
A |
1 |
1 |
|
B |
1 |
2 |
|
C |
1 |
3 |
|
D |
1 |
4 |
|
E |
1 |
5 |
Looking at the above
table we find that from combination A to E we are provided an additional right
shoe whereas the quantity of left shoe is constant. A consumer is achieving the same utility across all the combinations. In all the combinations except A, the
extra right shoe has no value or worth unless it is paired with an additional left
shoe. To increase the utility, the quantity of both shoe are to be increased in the
same proportion.
Let us understand this by drawing the
combinations of Scenario 1 on a graph.

Scenario 2:
Combinations offering the same utility
|
Combinations |
Right shoe |
Left shoe |
|
A |
1 |
1 |
|
B |
1 |
2 |
|
C |
1 |
3 |
|
D |
1 |
4 |
|
E |
1 |
5 |
Similarly, we can have another set of combinations for the Left
and Right shoe by changing the above scenario. In this case, we are increasing
the number of Left shoes by keeping the number of right shoes constant.
Here also the consumer is achieving the same utility across all the combinations. In
all the combinations except A, the extra left shoe has no value or worth unless
it is paired with an additional right shoe. To increase the utility, the quantity
of both the shoes are to be increased in the same proportion.
Let us understand this by drawing the
combinations on a graph.

So combining all the
above two scenarios, the final Indifference curve would look like this i.e.
L-shaped kinked at 90 degrees.

Example
2:
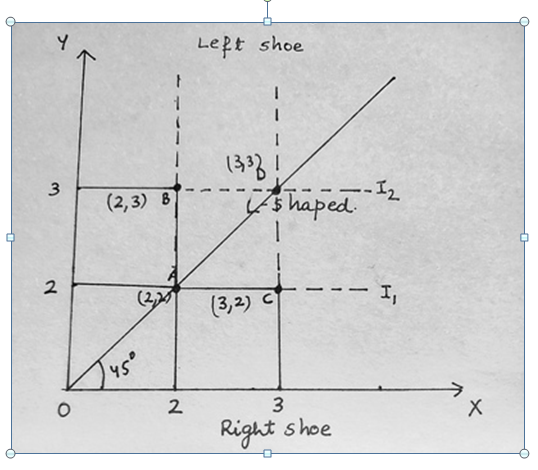
Suppose a consumer is provided three different bundles of pair of shoe (2, 2) (3,
2) (2, 3). Which bundle of pair of shoes is good among all and why?
A consumer is indifferent among all three bundles of pair of shoes as he will be getting the same utility in all these bundles but bundle with (2 Left shoes, 2 Right shoes) would be more appropriate as it can be used perfectly and the bundle (3, 2) and (2, 3) would be of no use because it needs to be coupled with either more of left shoes or right shoes. By this logic all the extra right shoe or left shoe would give no utility, thereby making all the combinations the same in terms of utility. A consumer will experience an increase in his utility when he will go with a bundle (3, 3) i.e. 3 Left shoes and 3 Right shoes.
Example
3: Suppose
a consumer is provided three different bundles of pair of shoe (5, 5) (5, 9) (9,
5). Which bundle of pair of shoes is good among all and why?
Ans: A consumer is indifferent among all three bundles of pair of shoes as he will be getting the same utility in all these bundles but bundle with (5 Left shoes, 5 Right shoes) would be more appropriate as it can be used perfectly. Whereas, the bundle (5, 9) and (9, 5) would be of no use because it needs to be coupled with either more of left shoes or right shoes. By this logic all the extra right shoe or left shoe would give no utility, thereby making all the combinations the same utility. A consumer will experience an increase in his utility when he will go with a bundle (9, 9) i.e. 9 Left shoes and 9 Right shoes.
Example 4: Perfect Complements-When both are increased equally
|
Left Shoe |
Right Shoe |
|
1 |
1 |
|
2 |
2 |
|
3 |
3 |
|
4 |
4 |
|
5 |
5 |
Plotting
values for Perfect Complements

Graphing
Perfect Complements

Explanation
The L –shaped kinked at 90-degree indifference curve indicates that bundle (2, 2) is better than a bundle (1, 1). Similarly, bundle (3, 3) is better off than bundle (1, 1) and (2, 2) and so on. Hence, bundle (5, 5) would be most preferred by the consumer as it has more of both the goods than other bundles of goods. Since the consumer’s utility will not increase when he or she gets a new right shoe without getting a new left shoe. A bundle (5, 5) gives the highest utility to the consumer than other bundles.
Example
5: Pencil and Erasers: Suppose an accountant needs 1
eraser for every 2 pencils he/she uses. Any more pencils will not be useful as
the accountant will not be able to erase the calculations. Any more erasers
will also not serve his purpose also.
Test
Yourself
Choose
the Correct Answer
1. If An indifference curve that is L-shaped represents:
a. goods
that are perfect substitutes
b.
goods that are perfect complements
c.
goods
that give zero utility
d.
goods that are necessities.
2. Which of the following bundles gives a consumer's highest utility?
a.
(1,
1)
b.
(2, 2)
c.
(3,
3)
d.
(5, 5)
3.
The indifference curves for left shoes and right shoes would most likely be
a. upward sloping and concave to the origin.
b. downward sloping and convex to the origin.
c. downward sloping and straight lines.
d. L-shaped.
4.
Perfect
complements have indifference curves that are kinked at 90-degree angles?
a.
True
b.
False
Answers:
1.
b
2.d 3.d 4.a


Comments
Post a Comment